Hotel Management Power BI Dashboard
Project Overview
This is an end-to-end Business Intelligence project focused on analyzing hotel revenue, occupancy, pricing, and booking performance. The project involved transforming raw hotel data, developing a structured data model, creating DAX measures, and designing an interactive Power BI dashboard for business decision-making. The project simulates real-world hotel operations and supports data-driven decision-making.
Business Problem
Hotel management needs a clear and centralized view of business performance across properties, cities, room categories, and booking platforms. With key performance indicators such as revenue, occupancy, Average Daily Rate (ADR), Revenue per Available Room (RevPAR), Daily Sellable Room Nights (DSRN), and Realisation %, it can be difficult to identify performance differences and trends without an interactive analytical solution.
The challenge is to transform hotel booking and operational data into meaningful insights that enable management to monitor performance, compare properties, analyze booking channels, and identify changes in key metrics over time.
This project addresses this challenge by developing an interactive Power BI dashboard that brings together hotel performance data and presents key business metrics in a format that supports data-driven decision-making.
Project Objectives
The main objectives of this project were to:
- Transform and prepare hotel data using Power Query to create clean, structured datasets for analysis.
- Develop a structured data model that connects hotel, room, date, and booking information for efficient analysis.
- Create DAX measures and KPIs to evaluate key metrics including Revenue, Occupancy %, ADR, RevPAR, DSRN, and Realisation %.
- Analyze hotel performance across properties, cities, room categories, and booking platforms.
- Identify performance trends by analyzing key metrics across different weeks and time periods.
- Build an interactive Power BI dashboard that allows users to filter and explore hotel performance and support data-driven decision-making.
Data Preparation
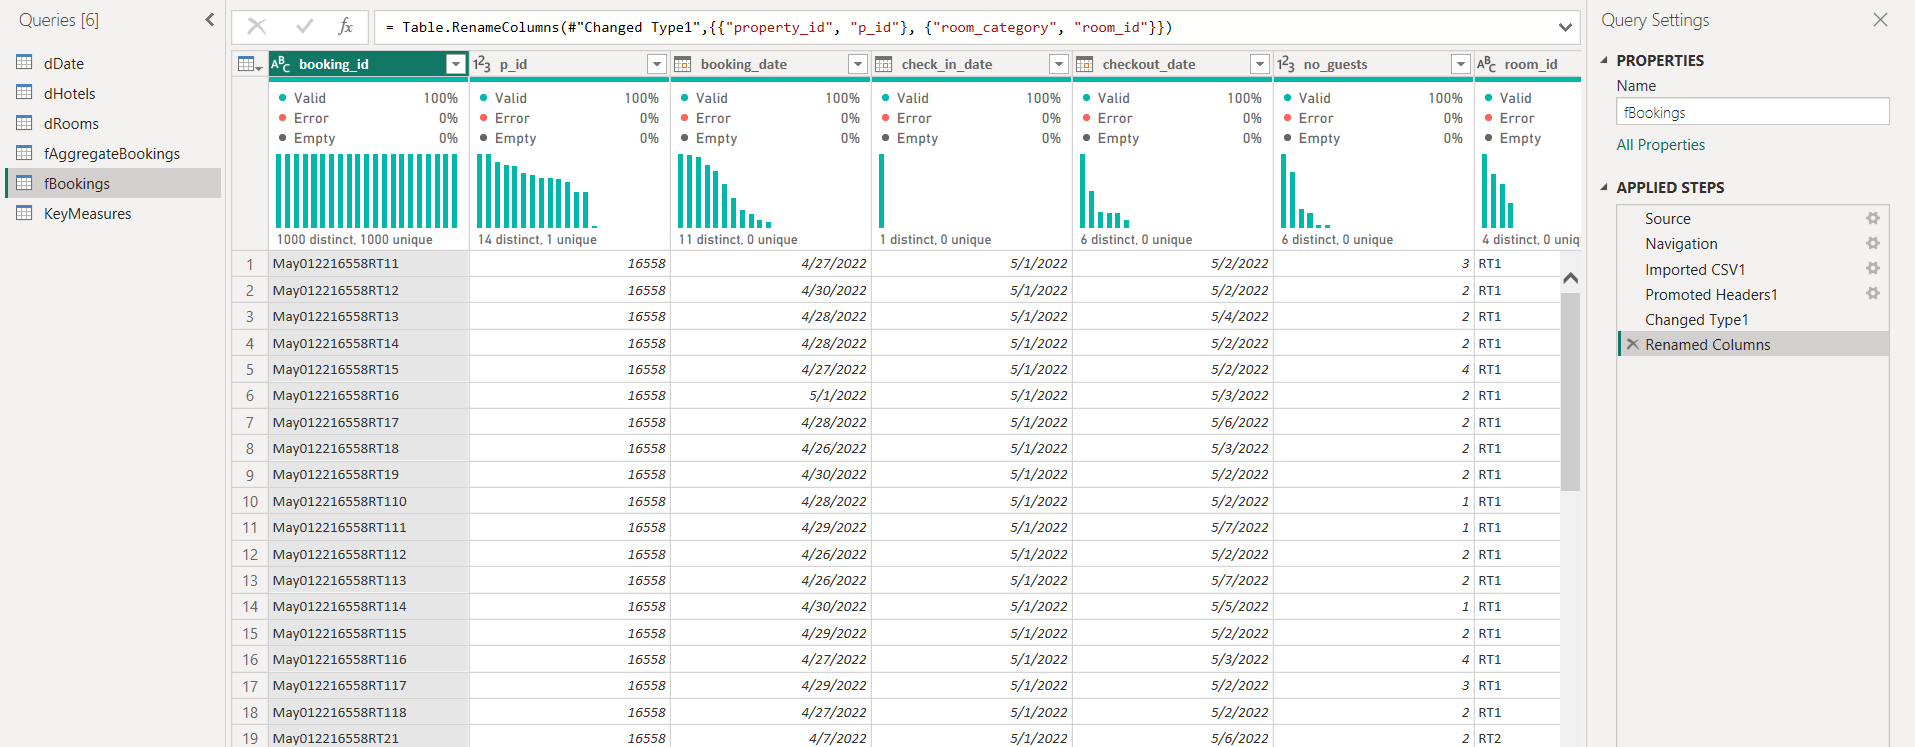
The hotel data was prepared in Power Query before being used for analysis and dashboard development. The preparation process focused on organizing the data into structured tables that could support analysis across hotels, rooms, dates, and bookings.
The project used tables including dDate, dHotels, dRooms, fBookings, and fAggregate Bookings. These tables provided the required data for analyzing hotel performance and calculating key business metrics.
The prepared data was then used to support analysis across different properties, cities, room categories, booking platforms, and time periods. This created a suitable foundation for the data model, DAX calculations, and interactive Power BI dashboard.
Key preparation activities included:
- Loading the required hotel datasets into Power BI.
- Preparing the data using Power Query.
- Organizing hotel, room, date, and booking information into separate tables.
- Preparing the data for relationships within the data model.
- Ensuring the datasets could support calculations for Revenue, Occupancy %, ADR, RevPAR, DSRN, and Realisation %.
- Preparing the data for analysis by property, room category, booking platform, and week.
Power Query
Power Query was used to prepare the hotel data before analysis and reporting. The data preparation process provided a structured foundation for the data model, DAX calculations, and dashboard development.
Data Modeling
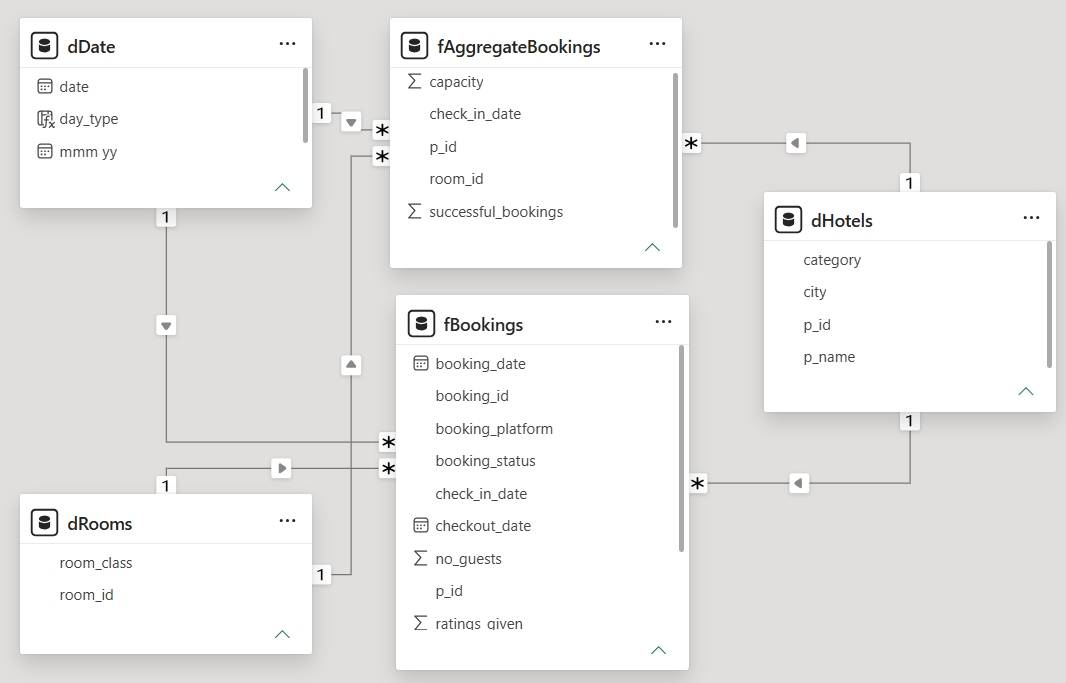
A structured data model was created in Power BI to connect the hotel, room, date, and booking data and support efficient analysis. The model uses separate dimension and fact tables to organize the data and establish relationships between the different areas of the hotel business.
The main tables in the model were dDate, dHotels, dRooms, fBookings, and fAggregate Bookings. The date, hotel, and room tables provide descriptive information, while the booking tables contain the transactional and aggregated booking data used for analysis.
A dedicated KeyMeasures table was also used to organize the DAX measures created for the dashboard. These measures support the calculation and presentation of key performance indicators such as Revenue, Occupancy %, ADR, RevPAR, DSRN, and Realisation %.
The resulting model provided a structured foundation for analyzing hotel performance across properties, cities, room categories, booking platforms, and time periods. This enabled the dashboard to provide interactive filtering and comparisons across different areas of the business.
Data Model
The Power BI data model brings together hotel, room, date, and booking information to support the analysis and reporting requirements of the project.
🔢 DAX & Key Metrics
DAX was used to create the measures required to evaluate hotel performance and present the results through interactive Power BI visualizations. The measures were organized in a dedicated KeyMeasures table, making them easier to manage and use throughout the report.
The dashboard focuses on several key hotel performance metrics:
- Revenue – measures the overall revenue generated from hotel bookings.
- Occupancy % – measures the proportion of available rooms that were occupied.
- ADR (Average Daily Rate) – measures the average revenue earned per occupied room.
- RevPAR (Revenue per Available Room) – evaluates revenue performance relative to available rooms.
- DSRN (Daily Sellable Room Nights) – represents the number of room nights available for sale.
- Realisation % – measures the proportion of bookings that were successfully realized.
- DBRN (Daily Booked Room Nights) – represents the number of room nights booked.
- DURN (Daily Utilized Room Nights) – represents the number of room nights actually utilized.
These measures were used throughout the dashboard to compare hotel performance across properties, room categories, booking platforms, cities, and different weeks. They also supported the weekly performance analysis and the Week-on-Week comparison indicators included in the report.
By using DAX measures rather than relying only on raw data fields, the dashboard could present business-focused KPIs that help management evaluate revenue, occupancy, pricing, and booking performance.
Dashboard
The interactive Power BI dashboard provides a consolidated view of hotel performance across revenue, occupancy, pricing, booking platforms, room categories, and weekly trends.
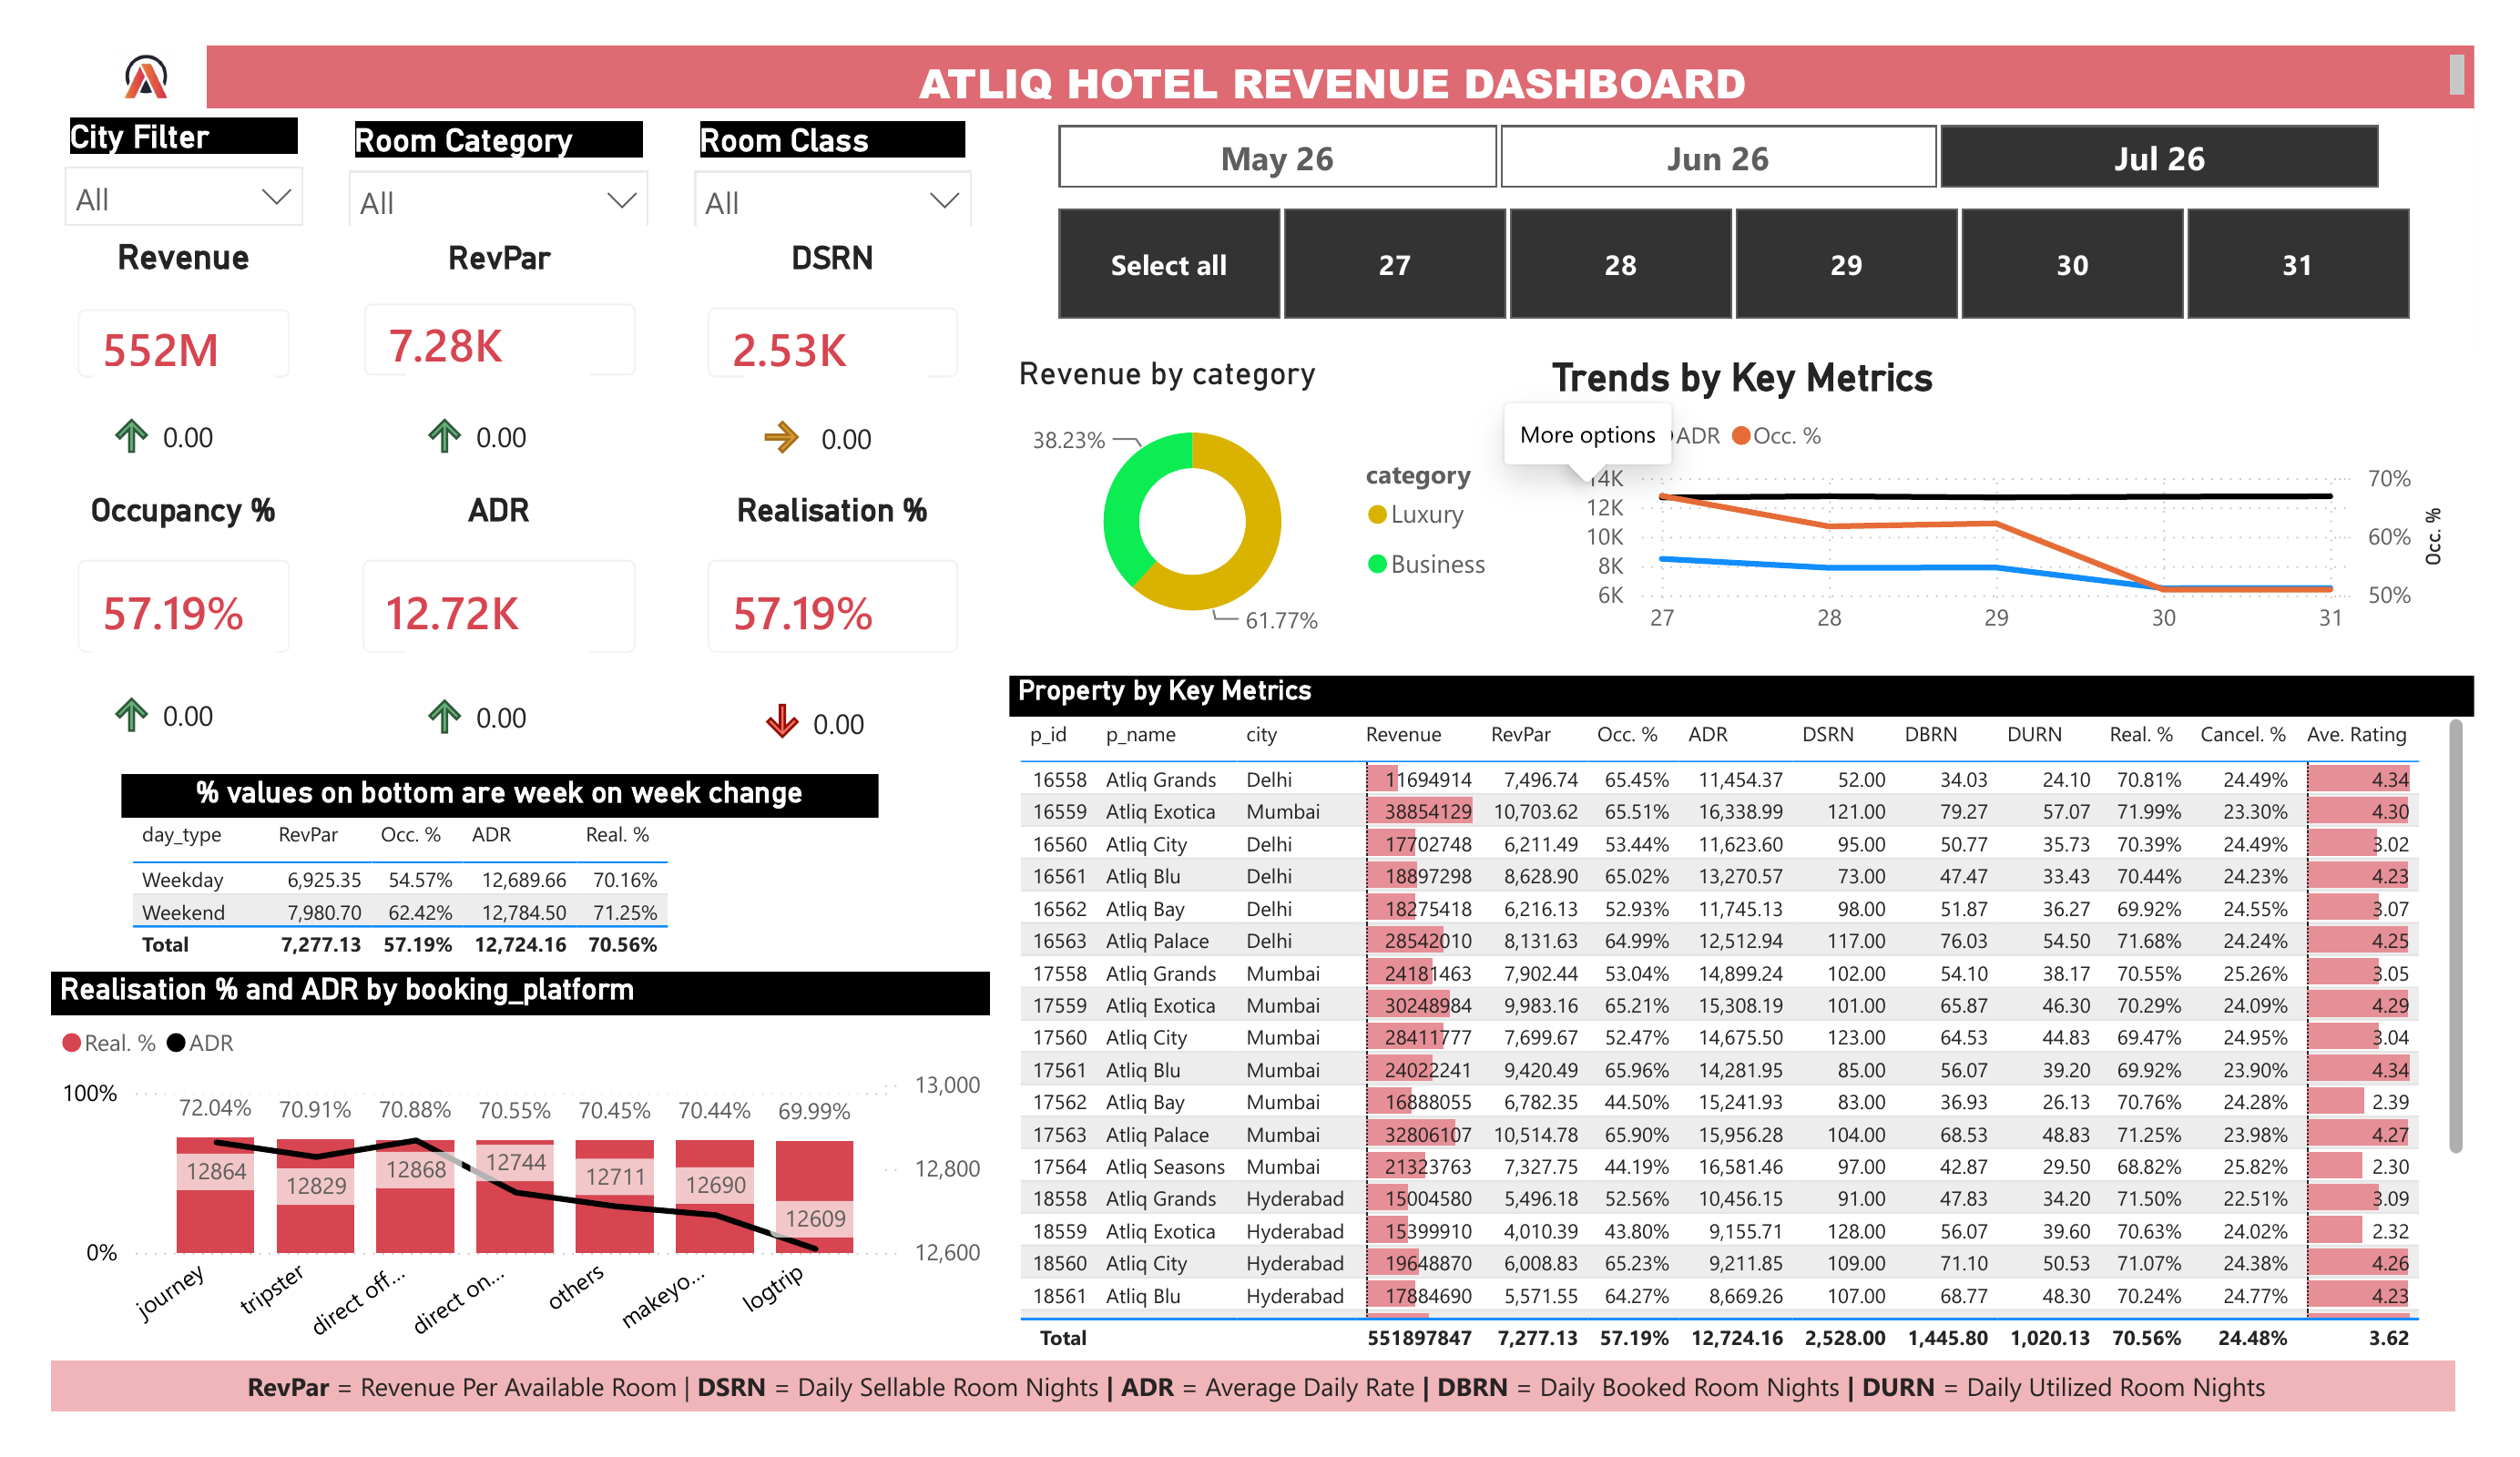
The dashboard allows users to explore performance using filters such as city, room class, room category, and time period. It also provides key performance indicators including Revenue, Occupancy %, ADR, RevPAR, DSRN, and Realisation %.
Key Business Insights
The dashboard provided several insights into hotel performance across revenue, occupancy, pricing, room categories, and booking platforms.
1. Overall Hotel Performance
The hotels generated approximately 551.9 million in revenue, with an overall occupancy rate of 57.19%. The average daily rate (ADR) was 12,724.16, while RevPAR stood at 7,277.13. These metrics provide management with an overall view of revenue generation, room utilization, and pricing performance.
2. Weekend Performance Was Stronger Than Weekday Performance
Weekend performance was stronger across the main hotel KPIs. Occupancy increased from 54.57% on weekdays to 62.42% on weekends, while RevPAR increased from 6,925.35 to 7,980.70. ADR also increased slightly from 12,689.66 to 12,784.50.
This suggests that the hotels experienced stronger room utilization and revenue performance during weekends.
3. Luxury Hotels Generated a Larger Share of Revenue
The dashboard shows that the Luxury category contributed 61.77% of total revenue, compared with 38.23% from the Business category. This indicates that the Luxury segment was the larger contributor to overall hotel revenue during the period analyzed.
4. Performance Varied Across Properties
The property-level analysis shows differences in revenue, occupancy, ADR, RevPAR, and other performance indicators across the hotels. For example, Atliq Exotica Mumbai recorded revenue of approximately 38.85 million and a RevPAR of 10,703.62, while other properties recorded considerably lower values.
This comparison allows management to identify stronger-performing properties and areas where further investigation may be required.
5. Booking Platforms Showed Differences in Realisation
The booking-platform analysis also revealed differences in realisation performance. Among the platforms displayed, Journey recorded the highest visible realisation percentage at 72.04%, while Logtrip recorded 69.99%.
This type of analysis can help management evaluate the performance of different booking channels and identify opportunities to improve booking realization.
6. Performance Could Be Monitored Over Time
The dashboard included weekly trends for ADR, Occupancy, and RevPAR, together with Week-on-Week performance indicators. This allows management to monitor changes in hotel performance over time rather than relying only on overall totals.
Business Value
The Hotel Management Power BI Dashboard transforms hotel booking and operational data into an interactive reporting solution that can support data-driven decision-making.
The dashboard provides management with a centralized view of important performance indicators, including Revenue, Occupancy %, ADR, RevPAR, DSRN, and Realisation %. This makes it easier to monitor overall performance and identify differences across properties, room categories, booking platforms, and time periods.
The analysis also enables management to:
- Compare property performance and identify hotels performing above or below other properties.
- Monitor occupancy and revenue performance across different periods.
- Evaluate pricing performance using ADR and RevPAR.
- Analyze booking platforms and compare their realisation and ADR performance.
- Compare weekday and weekend performance to identify differences in hotel demand.
- Track performance trends over time using weekly analysis and Week-on-Week indicators.
- Explore the data interactively through filters for city, room class, room category, and time period.
Overall, the dashboard provides a more structured and accessible way to analyze hotel performance, helping management move from raw booking data to meaningful business insights.
🛠️ Tools & Skills
Tools & Technologies
- Power BI – Dashboard development, interactive visualizations, filtering, and business reporting.
- Power Query – Data loading, preparation, and transformation.
- DAX – Creation of measures and key performance indicators.
- Data Modeling – Structuring and connecting hotel, room, date, and booking data.
- Interactive Data Visualization – Presenting hotel performance through KPI cards, tables, charts, trends, and comparisons.
Skills Demonstrated
- Data preparation and transformation
- Data modeling
- DAX calculations and KPI development
- Business intelligence and reporting
- Interactive dashboard development
- Hotel performance analysis
- Trend and comparative analysis
- Translating business requirements into data-driven insights
- Data-driven decision support
Project Resources
Conclusion
This project strengthened my ability to transform business data into an interactive Business Intelligence solution using Power BI. From data preparation and modeling to DAX development and dashboard design, the project provided practical experience in connecting technical data skills with business requirements.
The resulting dashboard demonstrates how structured data, business-focused KPIs, and interactive visualizations can be combined to support hotel performance analysis and data-driven decision-making.